Parishes of Ireland
CHOOSE A DATASET
CHOOSE A TIME
Wards of New York
Irish-born Emigrant Bank customers
Residence of Irish-born Bank customer(s)
Residence of Irish Bank customer(s) with link to census or other documents
ABOUT THIS MAP
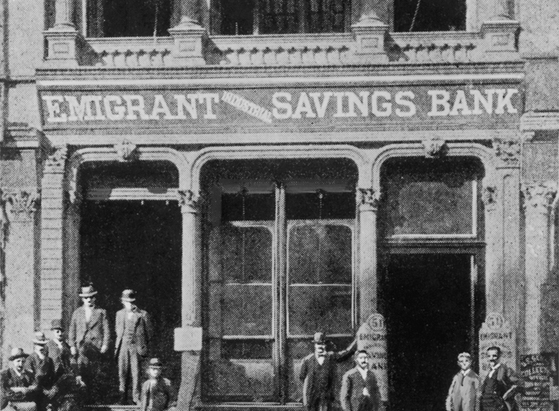
This map utilizes data gathered in the 1850s from customers of New York’s Emigrant Industrial Savings Bank (EISB) to uncover patterns in Irish emigration and residence in New York. The EISB records are uniquely suited to this task because bank employees asked new Irish depositors precisely where they had been born. One might assume that since the Great Famine of the late 1840s and early 1850s caused suffering all over Ireland, the emigration rate from parish to parish would have been fairly uniform. What these maps show, however, is that in most cases, the emigration rate from parish to parish varied widely, and was determined not by the severity of the Famine, but by the extent to which residents of each parish had established ties to New York before the potato blight struck in 1846. (The parish names and boundaries found on these maps are what the Irish referred to as “civil parishes,” not Roman Catholic parishes.)
The map refers to “EISB emigrants” to remind users that our dataset is comprised of about 11,000 Irish immigrants who opened accounts from the EISB’s founding in 1850 to the fall of 1858 (for accounts opened after that date, deposit and withdrawal records are no longer extant). Given that there were about 200,000 Irish immigrants in New York in 1855, that means the EISB records represent about a 5% sample of the city’s Irish community. But bear in mind that it is not a perfect sample. For example, 43% of adult male Irish immigrants in New York in 1855 worked at jobs like day laborer that required no skills or training, while only 39% of the EISB Irish customers held such jobs. Still, the bank’s customers are fairly representative of the city’s Irish immigrant population.
One of the most useful versions of the Irish map documents the per capita emigration rate by parish. That data gives the best sense of how much each parish was impacted by emigration. Keep in mind that the per capita figures, which represent the number of EISB depositors per 100,000 parish inhabitants, do not represent the total number of emigrants from a given parish. The actual number would have been much higher. But one can use these numbers to compare the rate of emigration from one parish to the next.
Finally, note that because Ireland’s major cities were subdivided into many tiny parishes that would not be visible on maps of this scale, the population of major cities is given in total and not broken down by parish.